10/8/09
Free WM-918 Vista software, free WMR-918 software, free WMR-968 software,
free WX-200 software for Vista and XP
This
is the manual for
Ken’s
Weather Station
For the Oregon Scientific WM-918, also
known as the Radio Shack WX200
For the WMR-918, WMR-928, WMR-968 and
compatible units
Click here
to download Ken’s Weather Station immediately. (770K bytes)
A Note from the Author
I
wrote this program because I don’t like how other programs display the
data. So if your goals or idiosyncrasies
are different from mine then you might not be satisfied with this program.
Other
programs allow multiple graphs, but only one sensor per graph. The philosophy of this program is that if
graphs are overlaid then the graphs can be larger. Clutter is reduced by:
1.
Eliminating sensor plots you have little
interest in.
2.
Assigning prominent colors (e.g. thick red) to
sensors you are most interested in.
3.
Assigning barely noticeable colors (e.g. thin
grey) to sensors you seldom want to see graphed.
The
program is offered free. It comes with
no guarantees and not much support. (You
get what you pay for.) You may email me
at kq6qv@aol.com. I will respond to all inquiries.
-Ken
System Requirements:
·
Windows
2000, XP, or Vista
·
RAM
Usage: 2M to 4M bytes while running
(depending on window size)
·
Hard
Disk: 770K bytes plus 1 megabyte/year of
saved data
·
Com
Ports supported: Any serial port with any name, or a USB adapter with software
serial port simulation
Screen Shots:
Principal Features:
·
This
program is a “gadget”: a program written
to run all the time and do so efficiently.
Simultaneously running other applications is no problem.
·
The
panel (window) can be resized, from very small to full-screen, and all
displayed items resize automatically.
·
A
wind gauge and two graphs can be displayed.
·
The
main (upper) graph can show up to 24 parameters simultaneously. The period of time covered is a selectable
number of days. 56 days is the upper
limit. The data points are always at
15-minute intervals.
·
The
long term (lower) graph can show only one parameter at a time, but it can show
three years or more of data. For most
parameters, it shows the daily highs and lows.
·
Sensor
average values are appended to a “Data” file every 15 minutes. Maximum and minimum sensor data is appended
to a “LongTerm” file after 24 hours.
·
Up
to 3 extra sensors are supported.
·
Upload
to CWOP and APRS.
·
A
UIView-compatible APRS file is stored.
(This feature is used by the ham radio community.)
·
Features
not included:
§
Upload
to Weather Underground.
§
Including
user-supplied bitmaps in the panel.
Installation:
There
is no formal installation procedure. You
just download it and run it. The first time
it runs it will prompt you for a few things, like where to put files. It is not a “registered” program and does not
show up in the list of installed programs.
Tryout:
When downloading, you don’t have to save the program to disk. You can run it directly upon download. In this case you should leave unchecked the
boxes “Save weather data” and “Save configuration”.
If
you decide the program is “a keeper”, you should create a folder for it and
move it there before it tries to store its configuration. The program saves its configuration in this
folder, so the folder should not be read-only.
The
configuration file is reorganized in version 2.00. If upgrading from version 1, you should write
down your configuration settings before trying version 2.
The current version:
2.02
This
program has been in constant use since May of 2007.
If
you try this version, please send me a note and tell me how it worked for
you. Also, be sure to check here
periodically to see if a newer version is available.
The
program is not regularly tested on Windows 2000. If you see a bug that might be specific to
Windows 2000, please report it to the author.
Whether the program runs on earlier Windows operating systems is
unknown.
Operating Procedures:
·
If
you click the Setup button, you can
change the program’s appearance. The
right mouse button also offers some options.
·
The
Graph 1, Graph 2, Graph 3, and Graph 4 buttons select what the main
(upper) graph shows.
·
If
you click any color panel on the setup window, it will allow you to change the
color.
·
A
vertical scaling factor is automatically chosen for each graph plot. You can override these choices using the max and min boxes on the setup window.
These values specify the parameter values at the top and bottom edges of
the graphs.
·
If
you click any point in the main or long term graphs, the numerical values are
displayed.
·
If
you click on the weather text, the program reports how well the radio links are
working.
·
Typing
an “R” (upper case) will reset the radio reception report data.
·
Typing
an “S” will write a Screen Shot to the file ScreenShot.bmp in the same folder as the weather data.
·
The
max and min sensor readings displayed on the main panel are reset at midnight.
·
Alarms,
notifications, and uploads are discussed below.
·
You
should provide the pressure correction. (The correction done by the weather
unit is ignored.)
Setting the Pressure
Correction:
1.
Enter the station
elevation on the setup window. These
might be helpful:
§ Borrow a GPS unit.
§ Google terrain maps have elevation lines.
2.
Check “Display sea
level pressure” on the setup window.
3.
The formula for sea
level pressure requires a temperature from 12 hours ago. If the program was not running 12 hours ago,
wait until this is true. (The pressure is displayed with a
dot after it when this temperature is missing.)
4.
Find an accurate sea
level pressure from nearby. This is best
if done on a good-weather day. Most
airports have weather stations, and http://weather.noaa.gov/index.html
summarizes them.
5.
Set the “Pressure
correction” on the setup window, adjusting it up or down until the program
reports the correct sea level pressure.
6.
It is best if you
repeat this procedure on different days and average the corrections. Over time the sea level pressure should
average 1013.25 millibars, or 29.92 inHg.
(If you cannot find your elevation, leave the pressure
correction zero and adjust the elevation number until the sea level pressure
matches the airport value.)
Implementation Details:
The Main Graph
·
You
can change the height of this graph, but it is always positioned at the top of
the window above the buttons, and it is always as wide as the window.
·
The
order in which the plots are drawn is implied by their order on the setup
window, in reverse order. You can change
this order. Typically the “Outdoor Temp”
is drawn last, thus making Outdoor Temp “topmost” on the graph.
·
The
program always keeps 56 days worth of data in RAM. When the program starts, it loads this data
from the files.
·
Data
points are for 15-minute periods ending at 00, 15, 30, and 45 minutes past the
hour per the Windows clock.
·
Data
points are an average of the sensor samples over the 15-minute period. Exceptions are Rain Total, Max Wind Speed,
and Min Wind Speed.
·
The
Average Wind Speed is the gust speed averaged over the 15-minute period.
·
The
Average Wind Direction is a proper geometric average over 15 minutes. (The gust direction is decomposed into
orthogonal components using sine and cosine functions, multiplied by the gust
speed, and added to variables called NorthWindSum and EastWindSum. At the end of 15 minutes, these two sums are
applied to an arctangent function, and the variables are zeroed.)
·
The
Average Wind Velocity is the “Pythagorean sum” of NorthWindSum and EastWindSum,
so it is a velocity, not a speed.
Suppose for a 15-minute period the wind blows from the north at 5 mph
for 7.5 minutes and then blows from the south at the same speed for the rest of
the period. The average velocity is
zero, and the average speed is 5 mph.
The velocity number is more enlightening as to where your air has come
from.
·
The
default top and bottom graph limits are as follows:
Parameter: bottom: top:
o
Outdoor
Temperature note 1 note 1
o
Outdoor
Dewpoint Temp note 1 note 1
o
Wind
Chill Temperature note 1 note 1
o
Indoor
Temperature note 1 note 1
o
Indoor
Dewpoint Temp note 1 note 1
o
Extra
Sensor Temperature note 1 note 1
o
Extra
Sensor Dewpoint Temp note 1 note 1
o
Outdoor
Humidity 0 % 100 %
o
Indoor
Humidity 0 % 100 %
o
Extra
Sensor Humidity 0 % 100 %
o
Barometric
pressure -40
millibars note 2 +40 millibars
note 2
o
Rain
Rate 0 4
inches/hour
o
Rain
Total 0 10
inches
o
Average
Wind Speed 0 40
miles/hour
o
Minimum
Wind Speed 0 40
miles/hour
o
Maximum
Wind Speed 0 40
miles/hour
o
Average
Wind Velocity 0 40
miles/hour
o
Average
Wind Direction 0º 360º
Note 1 - Temperature limits are chosen
by searching for the highest and lowest values that will appear in the
graph. This search includes all
temperature parameters together, but excludes any parameter that has a max or
min override specified on the setup window.
These highest and lowest values are then rounded up or down to a
multiple of 5.
Note 2 – When displaying sea level
pressure, the graph midline is always 1013.25 millibars. When displaying station pressure, the midline
is the 8-week average of the station pressure.
The Long Term Graph
·
This
graph is always at the bottom of the window.
You can control its height but not its width.
·
Tentative
“Long Term” data is written to disk at the end of every hour. So if the program is taken down for short
periods, little or no long term data is lost.
This tentative data is combined and moved to the Long Term file at
midnight. If the program is not running
at midnight, the data will be properly recorded on the following midnight. (The routine that runs at midnight can handle
multiple days and is able to avoid mixing data from different days. If the program is never allowed to run at
midnight then no data is ever provided for the Long Term graph.)
·
The
default top and bottom limits of the graph are always the highest and lowest
values being plotted. You can override
this using the setup window, but the values you supply will be cleared if you
switch parameters.
The Wind Gauge
·
This
gauge shows the gust wind direction.
·
The
gauge is always at the left edge of the window.
The area for it is always square.
You can specify a size for it, but your request will be ignored if it is
too big.
·
The
pink “rose pattern” shows the recent gust wind directions. It covers a period that includes the last 10
minutes of wind samples weighted proportional to the recentness of the
sample. (That is, the program uses a
windowing function that is triangular in time.)
·
To
make the rose pattern smooth, the sample direction is “smeared” some, up to
±20º. (That is, the wind sample is added
to adjacent directions using a windowing function that is triangular in
direction.)
·
The
contribution of a wind sample to the rose pattern is proportional to the gust
wind speed.
·
The
green line indicates where the air at your station has been for the previous
few hours (the path it has taken to reach your location). This line is drawn under the assumption that
the whole atmosphere moves as a single block with no mixing. It also assumes the wind at your location is
not distorted by the local terrain.
Since both of these assumptions are generally poor, the green line should
not be taken as very accurate.
·
The
number in the lower-left corner is the distance from your location to the
farthest point on the green line.
The Text Data
·
The
two small numbers beside the big number are the highest and lowest samples seen
during the day. These numbers are reset
at midnight and also when the program starts up.
·
Pressure: The number in parenthesis gives the offset
from the “average pressure” described below.
·
The
Rain Today number is since midnight.
·
The
Rain Rate is for the most recent 5 minutes.
Data file formats
·
The
recorded data files are text files that can be edited by any common
editor. They have fixed-column integer
formats.
·
The
integer formats for both the Data and Long Term files are the same:
o
The
recorded temperatures are always (T+40)*10, where T is in degrees Celsius.
o
Humidities
are H*10, where H is in percent.
o
Barometric
pressure is (P-500)*10, where P is the raw station pressure in millibars. The Pressure correction is not included.
o
Wind
speeds are W*10, where W is in meters/second.
o
Wind
headings are integer degrees. The
Direction correction is included.
o
Rain
is in millimeters. The value in the
“Data” files is the value taken from the weather unit’s memory (the “year to
date” value). The number in the “Long
Term” files has the midnight value subtracted from it.
o
Rain
Rates are in millimeters/hour. These
values are computed continuously and cover the preceding 5 minutes.
o
The
“sc” column is the sample count. In the
Data files it is the number of minutes of data, which normally will be about
15. During “Daylight Saving Time”, 50 is
added to this number. In the Long Term
file “sc” is the number of hours of recording that were included (normally 24).
·
Missing
data samples are represented as all minuses.
All nines are also allowed (e.g. 9999).
·
Records
are allowed for partial periods. During
loading, the program will combine data from records that pertain to the same
15-minute period, with weighting determined by the sample counts.
·
When
the program is taken down properly, it will write a record for the partial
period. This does not happen on some
Windows shutdowns, so you should terminate this program before shutting down
Windows.
About the data
·
The
date/clock value held in the weather unit is ignored. It does not have to be set.
·
The
following weather unit data is not
recorded by this program. Instead these
values are computed from other data fetched from the unit:
o
Time
and date
o
Time
of high and low values
o
High
and low temperatures and humidities (either indoor or outdoor)
o
High
and low wind speeds and rain rates
o
Dewpoints
o
Wind
chills
o
Sea-level
pressure or pressure trend
o
Rain
totals today or yesterday
o
Rain
rate
·
The
average wind direction (WM-918) and average wind speed kept by the weather unit
are fetched from the unit and displayed in the text data, but are not stored in
the files. Instead the 15-minute
averages of wind speed, velocity, and direction are computed from the gust
speed.
·
You
may reset the “year to date” rain total in the weather unit at any time. The program looks for these resets and
cancels them out when drawing the graphs.
·
The
Rain Rate is computed from the Rain Total (the year-to-date value). The rain rate is computed continuously and
always covers the preceding 5 minutes.
(A square windowing function is used.)
It is then treated as any other instantaneous sample. That is, it can immediately appear in the text
or trigger an alarm, and it is averaged over 15 minutes for the Main Graph and
the data files. For WM-918 units the
sampling period is generally exactly 5 minutes.
But the WMR-type units transmit about every 47 seconds, and occasionally
reports are lost when sensors transmit simultaneously, so the sampling period
is never exactly 5 minutes. The program
will search through past reports to find the one closest to 5 minutes ago and
will compute the rain rate using that one.
·
When
the Sea level pressure box is not checked, the program will show the “station
pressure”, which is the raw pressure received from the weather unit plus the
Pressure correction from the setup page.
It is plotted relative to the 8-week pressure average.
·
The
Dewpoint, Wind Chill, and Sea Level Pressure values displayed by this program
are computed from these standard formulas:
o
Tdp
= b*G/(a-G) where G = a*Tc/(b+T) + ln(RH/100)
Tdp
is the dewpoint in ºC
T is the measured temperature in ºC
RH is the relative humidity,
expressed as a number in the range 0 to 100
a=17.27
b=237.7
o
Twc
= 35.74 + .6215*T – 35.75*Vf + .4275*T*Vf
where Vf = antilog(log(V)*0.16)
Twc is the wind chill temperature in
ºF
T is the measured temperature in
ºF
V is the measured average wind speed
in miles/hour
Wind
chill is not defined above 50 ºF or for wind speeds below 3 mph. When those happen, the program will
substitute the actual temperature.
o
Psl
= Ps*exp(Es/H) where H =
287.1*T/9.80665
Psl is
the sea level pressure in millibars
Ps is the
station pressure in millibars (Pressure correction included)
Es is the
station elevation in meters
T is the
12-hour average temperature in ºK
The
12-hour average temperature is half the current temperature plus half the
temperature from exactly 12 hours ago.
When the 12-hour temperature is not available, the 8-week temperature
average will be used instead and a dot will appear after the pressure.
APRS data
The
data departs from the APRS specification in some minor ways:
1.
The
wind speed is a 15 minute average, not 1 minute.
2.
The
wind direction is a 15 minute geometric average, not 1 minute.
The
APRS file is a two-line file in the format expected by UIView. The file is rewritten every 15 minutes. The file is APRSfile.txt in the same folder as the weather data.
Alarms/Notifications/Uploads
Click
the “Alarms” tab on the setup window to see your notification options. Up to 46 alarms and 7 notifications can be
set simultaneously. Any of these can
ring the bell, play a sound, or call any program. This screen shot shows some examples:
·
If
you left-click a line, a box at the bottom of the window allows specifying the
alarm or notification.
·
If
you right-click a line it is immediately enabled or disabled.
·
Leaving
“program” blank specifies the console beep (ding).
·
If
the “program” ends in .WAV then
C:\Windows\Media is the default directory.
Otherwise the default directory is that which holds the WeatherStation.exe file. (Specifying .LNK or .BAT files does
not generally work.)
·
Alarms
for most parameters are caused by instantaneous weather readings, not 15-minute
averages. Exceptions are:
o
Av. Wind Velocity and Av. Wind Direction are 15 minute averages. The alarm can happen only at the end of a
15-minute period.
o
The Av. Wind Direction “wraps around”, so
both an Above and Below value must be specified. The Below number can be higher than the Above
number, in which case the alarm is for any direction between them. This alarm is not reported if the average
velocity is below 5 MPH.
o
Rain Rate is a 5 minute average. The alarm can happen instantly (at any time).
·
When
calling a program, a parameter is passed.
This parameter will be:
o
Every 15 minutes:
“01N ” followed by the new record that was just appended to the data
file. (Some additional parameters are passed. You may contact the author for an explanation
of these.)
o
Every hour:
“02N ” followed by the new “LongTermDataForToday” record.
o
Midnight:
‘03N “ followed by the new “LongTerm” record.
o
All other alarms and notifys:
A two-digit alarm number followed by an A (above), a B (below), or an N
(Notify). The alarm number is the same
as the list position on the setup window.
So for a high outdoor temperature alarm the parameter would be 01A.
·
Uploads
are the responsibility of the called program.
Either you can write this program or you can use the add-on described
below.
Add-on programs
Two
add-on programs have been written. You
may download and use them free.
o
Alarm.exe - This program will send an E-mail or announce
the alarm using text-to-speech software.
Also it can call another program, which is similar to what
WeatherStation.exe can do except “aboves” and “belows” can be distinguished. (The E-mail feature assumes the sending system
has a MAPI-compliant mail facility. AOL
is not MAPI-compliant. MS Outlook is.)
o
Upload.exe
- This program will upload
weather data to APRS or CWOP (Citizen’s Weather Observer Program, run by
NOAA). (The reporting period is always 15
minutes. Extra sensors cannot be
reported. You can specify the
server. If the transfer fails, Upload.exe
will retry it once after a 30 second wait.
If you do not have a Ham call-sign, you can apply for a CWOP ID at http://www.findu.com/citizenweather/signup.html To find your latitude and longitude, go to google.com,
click “maps”, type in your address, click “Satellite”, zoom in, right-click your station’s exact
location, and select “Directions from here”.
To reduce peak server demand, Upload.exe
waits a random amount of time, up to 4 minutes, before uploading the data. If you try to logoff or shutdown, this wait
is ended so that the data can be sent immediately, but this might not always
work properly. If you click the “UP” tray
icon, the data is sent immediately. The
“Wait time” box allows you to set this wait period to a fixed value.)
Using Add-ons
1.
Download
the program, putting it in the same folder as WeatherStation.exe.
2.
Execute
the program. (When called without
parameters, it enters “setup mode”.)
3.
Fill
in the necessary information and click “Done”.
4.
In
WeatherStation setup, click the “Alarms” tab.
5.
Type
the name of the add-on program, specifying it for an alarm’s “program”.
Download Alarm.exe now (500K bytes)
Download Upload.exe now (700K bytes)
More Screen Shots
Alarm.exe
Setup:
Upload.exe
Setup:
Hints for using the WMR-series units
1.
When
I first got my WMR-968 I was disappointed with the range of the sensors,
especially the Extra Sensors. Eventually
I discovered that my computer was interfering with reception. I recommend that the base unit be at least 20
or 30 feet from any computer or TV. The
computer will desensitize the base even if its emissions are not exactly 433.5
MHz. On top of that, you should
experiment to see if moving the base a foot one way or another causes any
improvement. (One foot is about a
half-wave for 433 MHz and is the typical dimension of the null pattern
resulting from reflections.)
Although
making the bases unit’s antenna vertical gives it non-directional performance,
there might be an orientation that picks up less interference from the
computer. If you find that some oblique
angle works better, the antennas for all the sensors should be at this same
oblique angle. (The transmitter’s
antenna should be parallel to the base unit antenna’s apparent direction as seen from the transmitter, assuming you could
see through obstacles such as walls.)
I
presently have the base unit just 15 feet away from my computer. But I was able to use a hand-held
communications receiver (ICOM IC-R10) to find a null spot for the base
unit. If you do not have such good test
equipment then your only safe option is to buy a serial cable at least 25 feet
long. A ferrite bead on the serial cable
at the base unit is also a good idea. Do
not plug the base unit power cord into the same outlets as the computer. If you have no other option, consider a power
line filter for the base.
2.
The
published specification for the range of the THGR122NX Extra Sensor is only 100
feet. But that number is for daytime and
no intervening obstacles. If the signal
has to go through or around an exterior wall then 25 feet is the typical limit
of usefulness at night. What is the
point of having four outdoor sensors if they have to be so close together?
The
antenna in the Extra Sensor is not very efficient. Fortunately I am an antenna expert. I designed a booster that adds 5.5 dB to the
antenna’s gain. You can easily build
it. No modification of the sensor is
necessary. It will double the range of
the unit to 200 feet. If there is an
intervening exterior wall, the booster will add 100 feet to whatever range you
see now. I haven’t tried the RT918
wireless repeater.
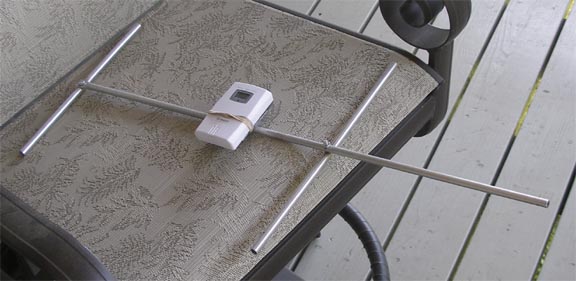
Your
best option is to cannibalize an old TV antenna. The 0.3-inch diameter aluminum rods are
ideal, and there is no other common supply of such material. Copper wire, 14 or 12 gauge, will also work
and might be the quickest way for a tryout.
Copper “refrigerator tubing” is another option. (Technically elements with noncircular
cross-sections will work fine, but there is no dependable way to predict the
correct element lengths.)
The
booster is called a “Three Element Beam”.
The shorter element is the “director”, and the longer element is the
“reflector”. The booster makes the
sensor a directional transmitter and it must be pointed at the base unit. The director is the front. The director and reflector must be vertical
if the base unit’s antenna is vertical.
Construction
notes:
·
The
reflector must be 6 inches from the sensor’s antenna, ±½ inch.
·
The
director must be 10 inches from the sensor’s antenna, ±½ inch.
·
The
sensor’s internal antenna is a coiled up dipole arranged vertically. It runs along the left edge of the
sensor. The rest of the sensor can be
considered transparent to 433 MHz.
·
The
lengths of the director and reflector depend on the diameter of the element
material. Find the lengths from the
graph below. Cut them ±1/8 inch. Do not smash the ends closed. (If you want to keep insects out, plug them
with some insulator.)
·
The
rod that connects the director and reflector to the sensor is called the
“boom”. It can be an insulator or a
conductor. If it is a conductor then it
must cross the sensor along the sensor’s midpoint and must touch only the
midpoints of the director and reflector.
·
If
copper wire is used, strip off all insulation.
·
The
sensor unit hangs on a “platform” that I bolted to the boom. The platform is thin plastic 2-inches by
3-inches. It must not be a
conductor.
·
The
antenna should be mounted away from other conductors. Wood becomes a conductor at 433 MHz when wet,
and concrete and soil do not have to be wet.
A conducting surface a few inches behind the reflector is no problem.
·
The
booster can be painted to make it less noticeable.
Revision history
Version
1.00 4/28/07
Noticed
but not fixed:
1.
Setting
the Main Graph start date does not work.
Version
1.01 11/??/07
Fixed:
1.
The
long term graph discarded all data for October, November, and December.
Noticed
but not fixed:
1.
The
program does not handle the transitions to and from Daylight Savings Time. (The program assumes all days are 24 hours
long.) This might never be fixed.
Version
1.02 2/13/08
Fixed:
1.
Wind
chill was computed using the average velocity.
It now uses the average speed.
New
feature: An APRS file is created.
Version
2.00 5/15/08
Fixed:
1.
Numerous
minor bugs.
2.
The
Main Graph start date now works.
New:
1.
An
Alarm feature and numerous minor features.
2.
The
program now works with WMR-918 type units, including the WMR-928 and the
WMR-968. The program can handle up to
three extra sensors.
3.
The
file data can be all minuses for missing data.
4.
The
file data now includes a Daylight Savings Time flag, but the present program
does nothing with it. If a future
version of the program graphs DST transitions properly then it will work with
data produced by Version 2.00.
Version
2.01 7/19/08
Fixed:
1.
The
APRS report period for maximum wind gust is now 5 minutes.
New:
1.
The
APRS data for 24-hour rain is deleted, but the 1-hour rain number is always
accurate.
2.
A
proper Sea Level Pressure is computed.
3.
Alarm.exe
is new.
4.
Upload.exe
is new. WeatherStation 2.01 is
required. The author’s weather station
is now a registered NOAA station. His
data can be seen at http://www.findu.com/cgi-bin/wxpage.cgi?call=kq6qv&last=72
.
Version
2.02 8/12/09
Fixed:
1.
Barometric
pressure in APRSfile
2.
Green
line mileage display